Photos | Analyzing Data on Laptop Screen
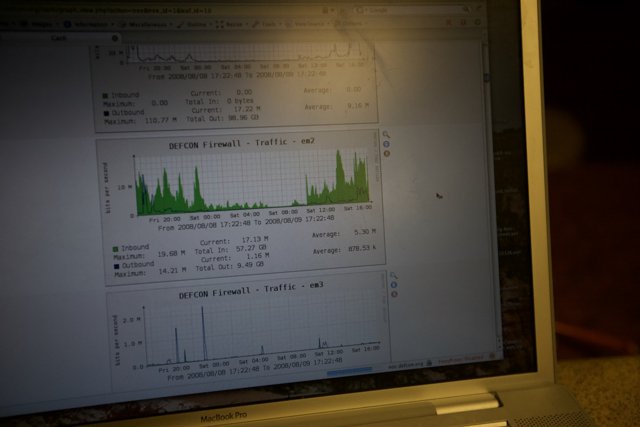
A detailed graph of data being analyzed on a laptop screen at Defcon Day 2 in 2008.
BLIP-2 Description:
a laptop screen showing a graph of dataChronologically Adjacent
Note: You can also navigate with your arrow keys or swiping.
Metadata
Capture date:
Original Dimensions:
4368w x 2912h - (download 4k)
Usage
Detected Text
0.0 0.00 00 04 08 09 1.0 1.16 10 110.77 12 14.21 16 17 17.13 17.22 19.68 2 2.0 20 2008 22 48 5.30 57.27 878.53 9.16 9.49 98.96 average bats bytes cr current defcon disabled em em3 firewall fra fri from gb google in inbound k m macbook maximum miscellaneous o out outbound outine per pot pro resize s sat second tions to total traffic м 年
iso
1600
metering mode
5
aperture
f/2.8
exposure bias
-0.67
focal length
35mm
shutter speed
1/2000s
camera make
Canon
camera model
lens model
date
2008-08-09T15:23:59-07:00
tzoffset
-25200
tzname
America/Los_Angeles
overall
(2.51%)
curation
(25.00%)
highlight visibility
(2.44%)
behavioral
(70.25%)
failure
(-0.76%)
harmonious color
(-1.24%)
immersiveness
(0.17%)
interaction
(1.00%)
interesting subject
(-84.67%)
intrusive object presence
(-20.46%)
lively color
(-25.39%)
low light
(0.83%)
noise
(-3.83%)
pleasant camera tilt
(-10.47%)
pleasant composition
(-45.73%)
pleasant lighting
(-45.26%)
pleasant pattern
(1.64%)
pleasant perspective
(4.42%)
pleasant post processing
(3.63%)
pleasant reflection
(-5.51%)
pleasant symmetry
(1.22%)
sharply focused subject
(0.44%)
tastefully blurred
(3.56%)
well chosen subject
(7.12%)
well framed subject
(23.99%)
well timed shot
(-1.70%)
all
(-7.90%)
* WARNING: The title and caption of this image were generated by an AI LLM (gpt-3.5-turbo-0301
from
OpenAI)
based on a
BLIP-2 image-to-text labeling, tags,
location,
people
and album metadata from the image and are
potentially inaccurate, often hilariously so. If you'd like me to adjust anything,
just reach out.