Photos | Analyzing Data Trends
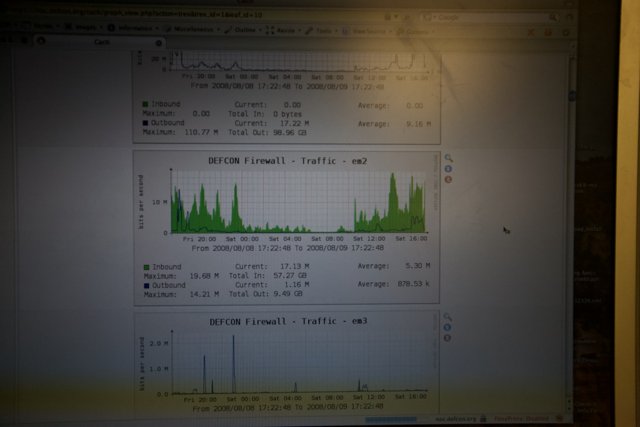
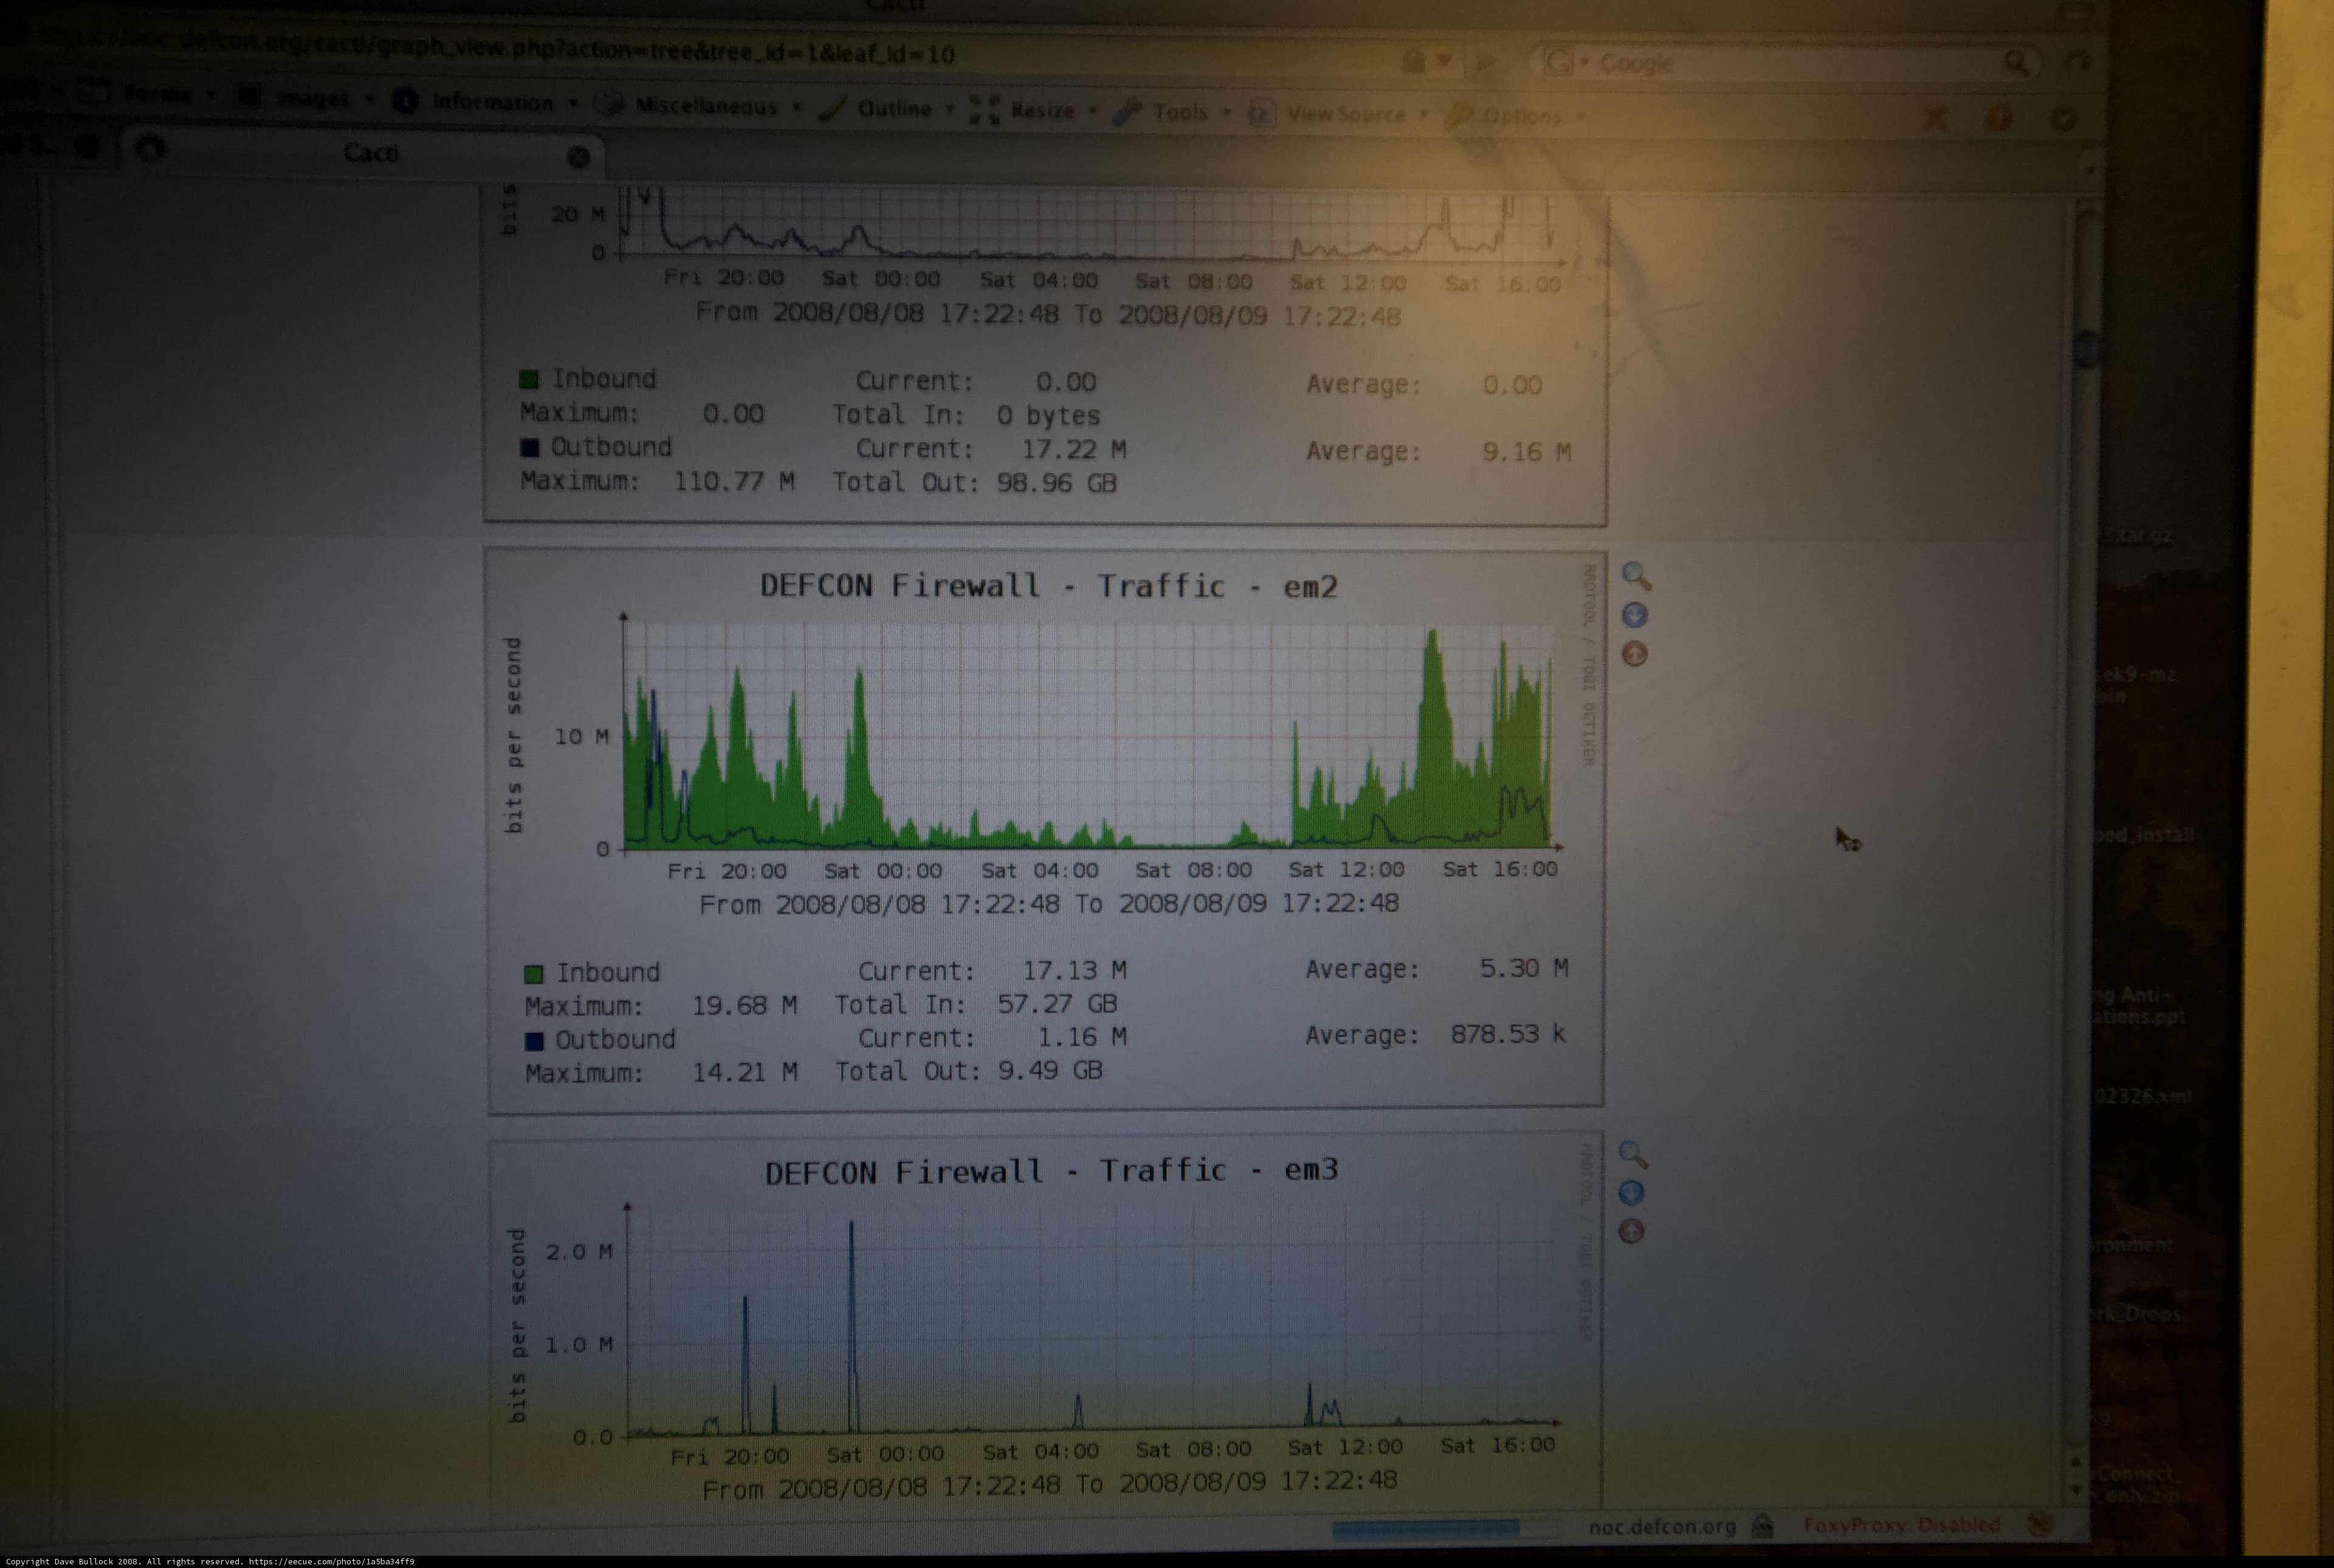
A computer screen displaying a detailed graph of data, with various electronic components in the background at Defcon day 2 in 2008.
BLIP-2 Description:
a computer screen showing a graph of dataChronologically Adjacent
Note: You can also navigate with your arrow keys or swiping.
Metadata
Capture date:
Original Dimensions:
4368w x 2912h - (download 4k)
Usage
Dominant Color:
Detected Text
0 0.0 0.00 00 02326 04 08 09 1.0 1.16 10 110.77 12 14.21 16 17 17.13 17.22 19.68 2.0 20 2008 22 2k9 48 5.30 57.27 878.53 9.16 9.49 98.96 anti average bits bytes cacti current defcon em em3 firewall fri from g gb in inbound information k m m2 maximum out outbound outine per sat second to total traffic м хт
iso
1600
metering mode
5
aperture
f/2.8
exposure bias
-0.67
focal length
34mm
shutter speed
1/2000s
camera make
Canon
camera model
lens model
date
2008-08-09T15:24:02-07:00
tzoffset
-25200
tzname
America/Los_Angeles
curation
(25.00%)
highlight visibility
(1.98%)
behavioral
(10.02%)
failure
(-1.73%)
harmonious color
(-0.82%)
immersiveness
(0.24%)
interaction
(1.00%)
interesting subject
(-86.08%)
intrusive object presence
(-6.42%)
lively color
(-13.65%)
low light
(0.15%)
noise
(-6.23%)
pleasant camera tilt
(-11.46%)
pleasant composition
(-26.54%)
pleasant lighting
(-46.61%)
pleasant pattern
(3.32%)
pleasant perspective
(-4.99%)
pleasant post processing
(-5.66%)
pleasant reflection
(-5.58%)
pleasant symmetry
(0.98%)
sharply focused subject
(0.20%)
tastefully blurred
(0.93%)
well chosen subject
(3.56%)
well framed subject
(2.15%)
well timed shot
(2.71%)
all
(-7.29%)
* WARNING: The title and caption of this image were generated by an AI LLM (gpt-3.5-turbo-0301
from
OpenAI)
based on a
BLIP-2 image-to-text labeling, tags,
location,
people
and album metadata from the image and are
potentially inaccurate, often hilariously so. If you'd like me to adjust anything,
just reach out.