Photos | Technical Chart Analysis
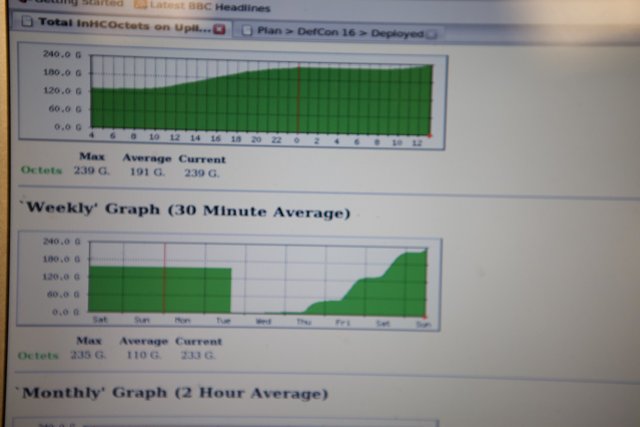
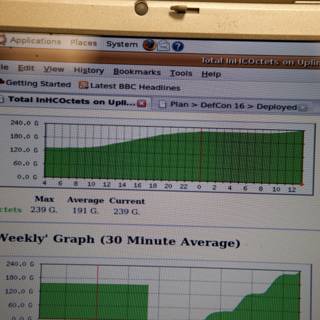
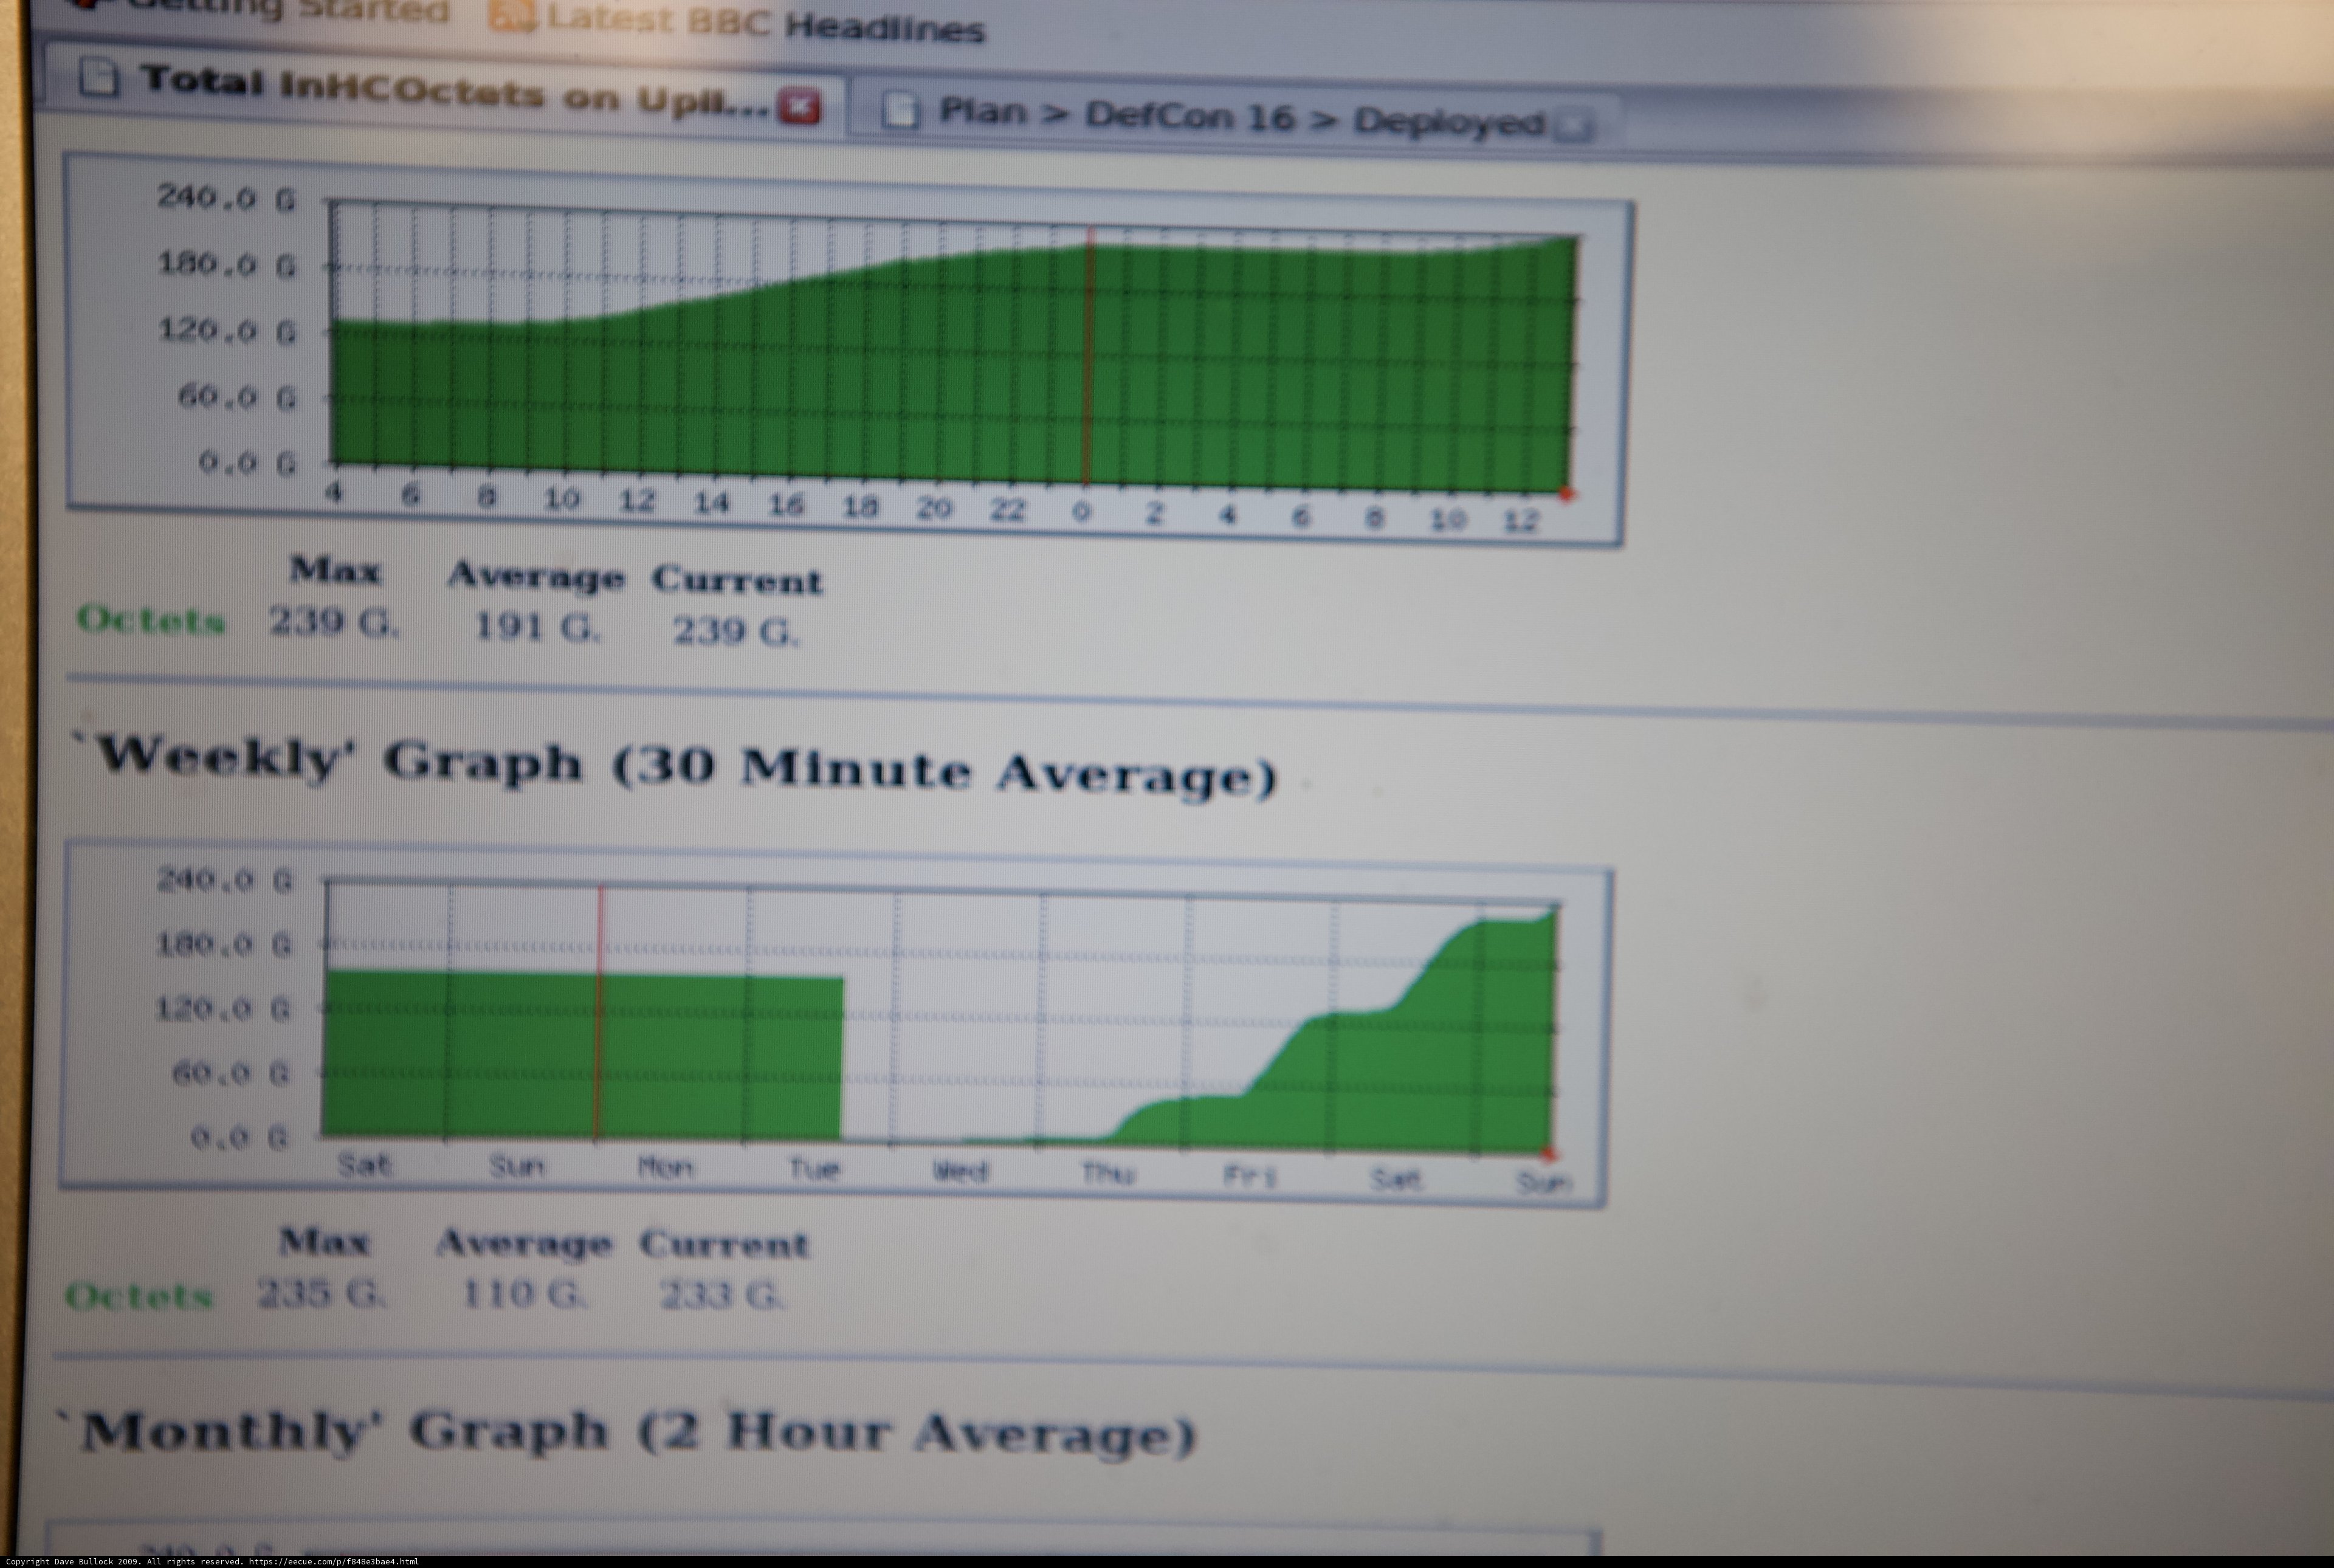
A computer screen displays a detailed chart documenting hardware and electronics data, from the 2009 Defcon 17 conference.
BLIP-2 Description:
a computer screen showing the graph of the graphChronologically Adjacent
Note: You can also navigate with your arrow keys or swiping.
Metadata
Capture date:
Original Dimensions:
5616w x 3744h - (download 4k)
Usage
Dominant Color:
g summer headlifes defcon latest eos plot apple ml current hour graph incoctets plan document headlines ii sun octets hardware negative mon upil line chart inhcoctets say weekly diagram sat total electronics deployed max sac wed tue screen average monitor august minute canon mark bbc monthly computer
Detected Text
iso
1600
metering mode
5
aperture
f/2.8
focal length
70mm
shutter speed
1/500s
camera make
Canon
camera model
lens model
date
2009-08-02T13:13:42.340000-07:00
tzoffset
-25200
tzname
America/Los_Angeles
curation
(25.00%)
highlight visibility
(1.98%)
behavioral
(10.02%)
failure
(-0.76%)
harmonious color
(-0.15%)
immersiveness
(0.10%)
interaction
(1.00%)
interesting subject
(-91.55%)
intrusive object presence
(-5.40%)
lively color
(6.96%)
low light
(0.02%)
noise
(-6.47%)
pleasant camera tilt
(-11.81%)
pleasant composition
(-32.74%)
pleasant lighting
(-28.96%)
pleasant pattern
(4.22%)
pleasant perspective
(-6.34%)
pleasant post processing
(-12.07%)
pleasant reflection
(-8.77%)
pleasant symmetry
(1.00%)
sharply focused subject
(0.68%)
tastefully blurred
(-6.99%)
well chosen subject
(12.04%)
well framed subject
(4.99%)
well timed shot
(-1.00%)
all
(-5.81%)
* WARNING: The title and caption of this image were generated by an AI LLM (gpt-3.5-turbo-0301
from
OpenAI)
based on a
BLIP-2 image-to-text labeling, tags,
location,
people
and album metadata from the image and are
potentially inaccurate, often hilariously so. If you'd like me to adjust anything,
just reach out.